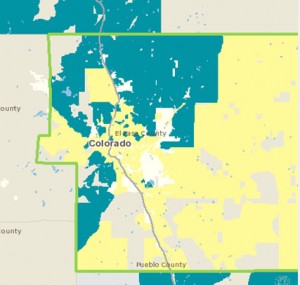
The following maps are of Colorado Springs represent how affordability is measured traditionally and affordability when transportation costs are included. In the top image (Housing Only), the yellow represents areas where the average residential housing expenses are less than 30% of total household income. The blue represents areas where housing costs average more than 30% of total household income. The grey areas are those that are either not applicable or information is not available.
The next map shows the inclusion of transportation costs with housing costs. It considers 45% as the affordable defining mark (yellow is affordable; blue is not affordable). The data for both maps is based on 2008 census data where the region median household income is $46,844. Additional maps can be compared on the Center for Neighborhood Technology website at www.htaindex.com.
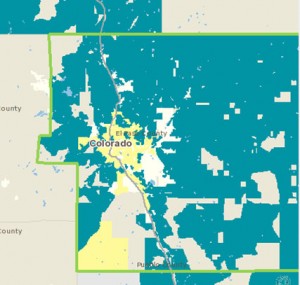
As you can see in the map comparisons, areas that are seemingly affordable and residents can live within 30% of the income can have an overwhelming amount of automobile expenses. Hidden auto expenses include registration, insurance, regular maintenance charges, major maintenance charges, lease/own payments and of course the expense of gasoline. Registration, insurance and own/lease expenses are typically constant expenses however some households living near work, or city centers are able to avoid multiple cars and in more urban areas car ownership completely. In Colorado Springs, car ownership is an expense that is difficult to avoid with poor transit opportunities.


